- The Triglav Group and its parent company operated at a profit and achieved high profit growth.
- The Group strengthened its dominant position in both the Adria region and the Slovenian insurance market.
- Premium growth was achieved in all insurance markets and all insurance segments. The value of assets under management increased.
- The Group continues to be financially sound, its capital adequacy is within the target range and the “A” credit rating has a stable medium-term outlook.
- By revising its strategy to 2025, the Group defined its future growth and development.
Financial highlights of the Triglav Group
|
| |
|
|
| | | in EUR million | |
| | | 2021 | 2020 | 2019 | 2018 | 2017 | Index | |
|
| |
|
|
| | | 2021/2020 | 2020/2019 |
| Total revenue | 1,455.1 | 1,318.4 | 1,260.9 | 1,134.4 | 1,063.2 | 110 | 105 | |
| Gross written premium from insurance, coinsurance and reinsurance contracts | | 1,353.0 | 1,233.8 | 1,184.2 | 1,068.4 | 999.9 | 110 | 104 |
| Net premium income | | 1,119.8 | 1,066.8 | 1,027.6 | 951.8 | 891.2 | 105 | 104 |
| Gross claims paid | | 736.6 | 697.4 | 716.7 | 679.6 | 642.2 | 106 | 97 |
| Net claims incurred | | 715.0 | 683.6 | 684.1 | 626.6 | 620.0 | 105 | 100 |
| Gross operating expenses | | 333.4 | 306.7 | 305.3 | 288.8 | 274.0 | 109 | 100 |
| Profit before tax | | 132.6 | 90.9 | 100.9 | 97.5 | 84.4 | 146 | 90 |
| Net profit | | 113.0 | 73.7 | 83.9 | 80.8 | 69.7 | 153 | 88 |
| Net profit attributable to the controlling company | | 112.8 | 73.5 | 83.7 | 80.7 | 69.3 | 153 | 88 |
| Combined ratio | | 88.9% | 91.2% | 91.5% | 91.8% | 93.1% | 98 | 100 |
| Insurance technical provision as at 31 December | | 3,198.7 | 3,033.2 | 2,878.9 | 2,713.1 | 2,732.2 | 105 | 105 |
| Equity as at 31 December | | 933.0 | 870.2 | 792.0 | 746.9 | 756.6 | 107 | 110 |
| Equity attributable to the controlling company as at 31 December | | 930.5 | 867.6 | 789.5 | 744.6 | 749.8 | 107 | 110 |
| Return on equity | | 12.5% | 8.9% | 10.9% | 10.8% | 9.3% | 141 | 81 |
| Return on equity attributable to the controlling company | | 12.5% | 8.9% | 10.9% | 10.8% | 9.3% | 141 | 81 |
| Book value per share (in EUR) | | 40.93 | 38.16 | 34.73 | 32.75 | 32.98 | 107 | 110 |
| Net earnings per share (in EUR) | | 4.97 | 3.24 | 3.69 | 3.56 | 3.07 | 153 | 88 |
| Number of employees as at 31 December | | 5,264 | 5,316 | 5,281 | 5,166 | 5,151 | 99 | 101 |
Financial highlights of Zavarovalnica Triglav
|
| |
|
|
| | | in EUR million | |
| | | 2021 | 2020 | 2019 | 2018 | 2017 | Index | |
|
| |
|
|
| | | 2021/2020 | 2020/2019 |
| Total revenue | | 848.6 | 765.2 | 743.2 | 700,2 | 660,7 | 111 | 103 |
| Gross written premium from insurance, coinsurance and reinsurance contracts | | 794.4 | 719.3 | 702.1 | 660.2 | 622.0 | 110 | 102 |
| Net premium income | | 598.8 | 583.9 | 573.6 | 551.9 | 522.1 | 103 | 102 |
| Gross claims paid | | 408.9 | 408.3 | 425.2 | 421.0 | 411.3 | 100 | 96 |
| Net claims incurred | | 365.1 | 375.3 | 376.8 | 359.9 | 376.3 | 97 | 100 |
| Gross operating expenses | | 195.0 | 180.0 | 180.5 | 174.4 | 167.7 | 108 | 100 |
| Profit before tax | | 85.7 | 71.1 | 84.6 | 78.5 | 73.8 | 121 | 84 |
| Net profit | | 73.4 | 58.0 | 70.6 | 65.5 | 62.5 | 127 | 82 |
| Combined ratio | | 81.8% | 86.1% | 85.6% | 86.1% | 87.9% | 95 | 101 |
| Insurance technical provisions as at 31 December | | 2,280.5 | 2,199.0 | 2,149.0 | 2,061.4 | 2,103.4 | 104 | 102 |
| Equity as at 31 December | | 675.2 | 644.0 | 580.5 | 560.1 | 571.4 | 105 | 111 |
| Return on equity | | 11.1% | 9.5% | 12.4% | 11.6% | 11.0% | 117 | 77 |
| Book value per share (in EUR) | | 29.70 | 28.33 | 25.53 | 24.64 | 25.13 | 105 | 111 |
| Net earnings per share (in EUR) | | 3.23 | 2.55 | 3.11 | 2.88 | 2.75 | 127 | 82 |
| Number of employees as at 31 December | 2,246 | 2,244 | 2,253 | 2,290 | 2,285 | 100 | 100 | |
Environmental, social and governance (ESG) aspects of the Triglav Group's operations
|
| 2021 | 2020 | 2019 | Index | |
|
|
|
|
| 2021/2020 | 2020/2019 |
| 1. Environmental aspects |
|
|
|
|
|
| Scope 1–2 carbon footprint (tonnes of CO2 equivalent)* | 10,997 | 10,258 | 11,127 | 107 | 92 |
| Scope 1 and 2 carbon footprint per employee (tonnes of CO2 equivalent)* | 2.09 | 1.93 | 2.11 | 108 | 91 |
| Electricity consumption (MWh) | 14,087 | 12,841 | 13,382 | 110 | 96 |
| Share of electricity consumption from renewable sources (%) | 60.1 | 2.7 | 0.9 | 2,234 | 306 |
| Total amount of waste per employee (tonnes) | 0.12 | 0.12 | 0.11 | 99 | 114 |
| Average daily consumption of office paper per employee** | 14 | 45 | 53 | 31 | 85 |
| Number of insurance products promoting environmental responsibility | 5 | 4 | 2 | 125 | 200 |
| Investments in social impact, green and sustainable bonds (EUR million) | 204.5 | 104.3 | n.p. | 196 |
|
| 2. Social aspects |
|
|
|
|
|
| Employee satisfaction (ORVI) | 4.00 | 3.99 | 3.88 | 100 | 103 |
| Average employee age | 44.67 | 44.38 | 44.06 | 101 | 101 |
| Women employees to total employees ratio (%) | 53.9 | 53.50 | 53.49 | 101 | 100 |
| Proportion of women at first and second management levels under the management board (%) | 42.0 | 42.1 | 43.5 | 100 | 97 |
| Employee turnover (number of leavers/average number of employees; %) | 13.2 | 11.7 | 14.4 | 113 | 81 |
| Average number of training hours per employee | 31 | 24 | 31 | 130 | 77 |
| Lost time incident rate – LTIR (number of work-related incidents/total number of hours of all employees x 200,000) | 0.24 | 0.21 | 0.38 | 117 | 54 |
| Client satisfaction at Zavarovalnica Triglav (NPS)*** | 72 | 68 | 60 | 106 | 113 |
| Number of insurance products and services sold online | 21 | 20 | 18 | 105 | 111 |
| Number of insurance products promoting prevention | 61 | 62 | 62 | 98 | 100 |
| Proportion of employees allowed to work from home (%) | 58.3 | n.p. | n.p. | | |
| Number of suppliers checked against ESG criteria | 375 | 311 | 140 | 121 | 222 |
| Investments into the community (prevention, donations, sponsorships) (EUR million) | 8.7 | 7.8 | 7.4 | 111 | 105 |
| 3. Governance aspects |
|
|
|
|
|
| Proportion of women in the management board/supervisory board/at the first management level under the management board (%) | 33.3/0/45.3 | 33.3/0/45.8 | 33.3/11.1/46.9 |
|
|
| Average age of Zavarovalnica Triglav Management Board members | 48.7 | 47.7 | 46.7 | 102 | 102 |
| Independence of Zavarovalnica Triglav Supervisory Board members, shareholder representatives (% of members) | 100 | 100 | 100 | 100 | 100 |
| President of the Management Board salary to the average employee salary ratio (factor x)**** | 5 | 5 | 5 | 100 | 100 |
| Term of office of the current President of the Management Board (years) | 8 | 7 | 6 | 114 | 117 |
| Policies adopted: equal opportunities policy, anti-corruption policy, employee protection/whistleblower protection policy | YES | YES | YES |
|
|
| Fair business practices (number of fraud cases investigated) | 1,517 | 1,134 | 1,040 | 134 | 109 |
| Internationally renowned audit firm (Big 4) | YES | YES | YES |
|
|
| Period of cooperation with the existing auditor (years) | 3 | 2 | 1.0 | 150 | 200 |
| Investor relations when publishing results | YES | YES | YES |
|
|
| Economic value generated (EUR million) | 1,378.8 | 1,274.9 | 1,292.4 | 108 | 99 |
| Economic value distributed (EUR million) | 1,281.8 | 1,179.2 | 1,245.6 | 109 | 95 |
| Economic value retained (EUR million) | 96.9 | 95.7 | 46.8 | 101 | 204 |
* Includes Scope 1 and 2 emissions under the location-based method. A more detailed calculation of Scope 1, 2 and 3 GHG emissions is shown in Section 12.3.2 of the Annual Report.
** Includes A4 paper consumption for internal purposes.
*** NPS shows the share of promoters who would recommend the Company to their acquaintances, friends and others based on experience.
**** Pursuant to the ZPPOGD, the base salary of the President of the Management Board is determined in relation to the average gross salary in the Group members which are headquartered in Slovenia and whose data are included in the consolidated annual report in the previous financial year.
Profit before tax in EUR million
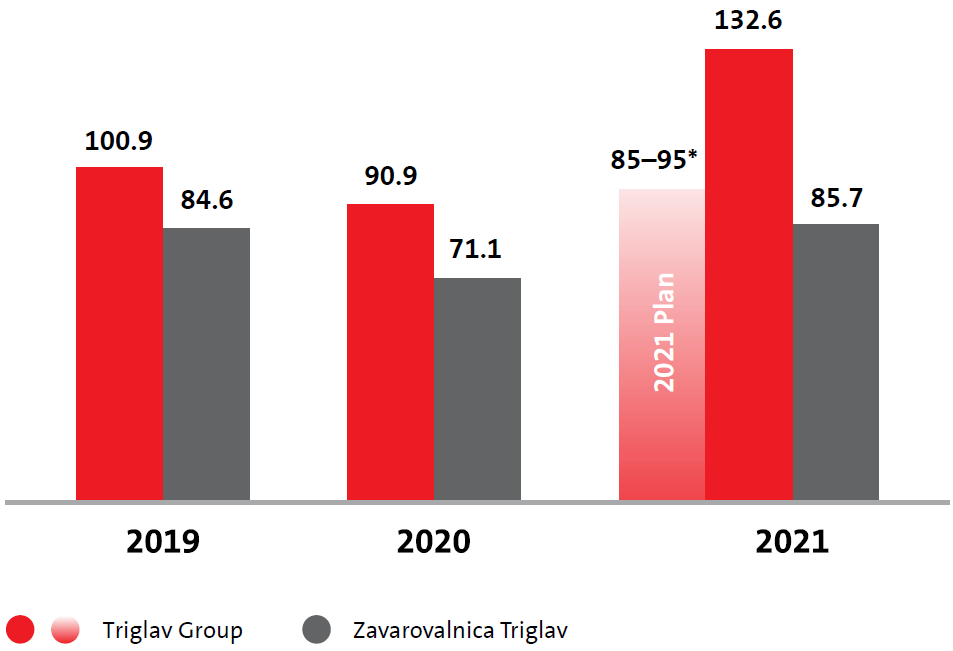 * Interim estimate of profit before tax of EUR 115–125 million.
For additional information about this report please contact:
Zavarovalnica Triglav, d.d., Ljubljana
Miklošičeva cesta 19, 1000 Ljubljana
Tomaž Žust, Director of Strategic Planning and Controlling Department
Telephone: +386 (1) 47 47 449
Fax: +386 (1) 23 16 456
Email: tomaz.zust@triglav.si